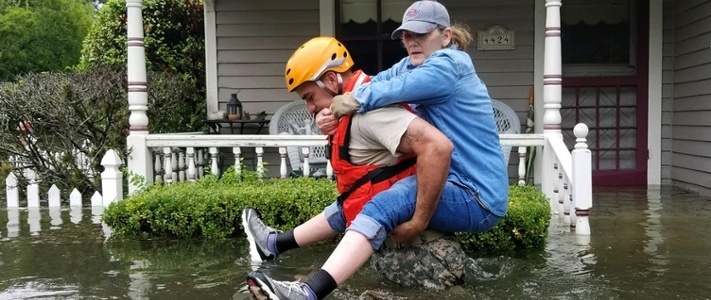
According to a recent article published in The New York Times, water damage from hurricane Harvey extended far beyond flood zones. Now that the rescue efforts are underway, it’s clear that much of the damage occurred outside of the typical boundaries drawn on official FEMA flood maps.
It is estimated that about two thirds of the inundation occurred outside of the areas marked as flood zones on FEMA's flood maps. This highlights a bigger underlying problem - that the maps are based on historical patterns that can no longer predict the current climate conditions.
If this is true then we’re way off in terms of policies, city & town planning, and building and infrastructure codes since we’re still constructing our cities and towns based on the climate conditions of the past rather than the future.
Big Data To The Rescue
Even though it is nearly impossible to predict any natural hazard with 100% accuracy due to a large number of complex environmental factors that come into play, we now have access to volumes of new data that was previously not available such as data from sensors, social data, improved satellite data etc. that we can use to better our existing models and improve their accuracy.
In other words we now have data for new variables to incorporate in our existing models that was not available to us before. Thanks to so-called “big data” and a growing number of digital data sources, we now have a better chance to improve our risk models to minimize the damage that we just saw as a result of Harvey and Irma in the past couple of weeks.
Earthquakes
Several studies and projects have already shown the positive results from big data’s utility in monitoring hazards and mitigating vulnerabilities in the case of earthquakes, floods and storms. In 2009, a group of scientists demonstrated that it is possible to detect small earthquakes through a global network of computers connected via the Internet, highlighting the existing capacity to develop rapid earthquake early warning systems at relatively low cost thanks to distributed data collected from the Internet. In 2014 another group of scientists (Musaev, Wang, and Pu) developed LITMUS, a model to detect landslides following earthquakes by integrating multiple social data sources such as Twitter, Instagram, and YouTube with physical sensors (USGS seismometers and TRMM satellite), The model scored better than traditional techniques employed by USGS for real-time hazard mapping.
Floods
Image Source: http://www.gdacs.org/flooddetection/
Big data can also allow early detection of floods. A group of scientists built a real time map of location, timing and impact by utilizing information related to floods from Twitter and satellite observations. The map is constantly updated and can be accessed online.
Data from social media can be useful in qualitative situational analysis before, during and after the incident. Floodtags (a social media analytics platform) was employed to extract information from Twitter, enabling the filtering, visualization, and mapping of social media content based on location and keywords. Satellite data came from the Global Flood Detection System (GFDS), which provides a service for rapid identification of inundated areas through daily passive microwave satellite observations. The approach was tested in the Philippines and is proving to be particularly appropriate for monitoring large floods in densely populated areas.
In the Netherlands where the vast majority of population lives in flood prone areas, the government has started experimenting with how machine learning may help strengthen preparedness to future floods. Also in Australia, the New South Wales State Emergency Service developed an early warning system able to perform predictive analysis of floods in the region based on the integration of the Bureau of Meteorology’s external data and additional datasets (e.g. data from flood plain, historical data information from various databases).
Storms & Hurricanes
Larger data sets have also been proven helpful in predicting storms, hurricanes and typhoons. When researchers combine various distributed data sets it can help them gain unique insights into the storm systems. They can then build better tools that simulate the weather based on the realtime data sets that are available today for mapping and analyzing meteorological hazards.
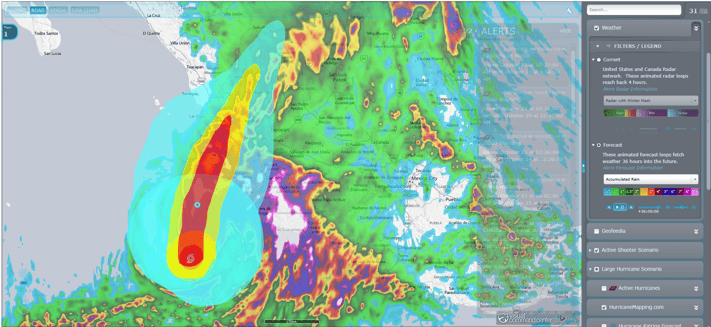
(Image Source: https://idvsolutions.com/) Hurricane Patricia - NWS 36-hour rain accumulation forecast and projected storm path and wind swaths from hurricanemapping.com
As an example, the image above shows Hurricane Patricia in 2015. The image combines 36-hour forecast rainfall accumulation data (NWS) with HurricaneMapping.com’s storm path and wind swath data.
Another example of data visualization can be seen in the image below. It graphs hurricanes and tropical storms since 1851 and uses colors (more green is more severe) to show the severity of hurricanes and the progression of the hurricanes along their tracks.
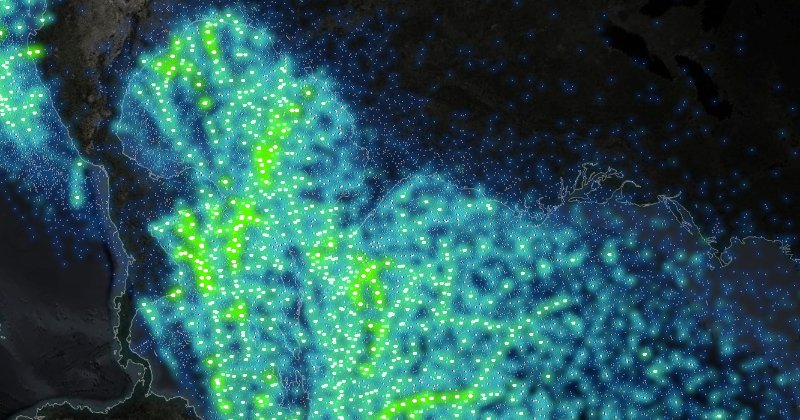
Image Source: https://idvsolutions.com/
One key observation that can be made by looking at this visualization is that the strongest hurricanes do in fact avoid land in their formation. It is a great example of how data visualization is changing analysis. In a few minutes, complex relationship between location, direction, intensity, and reporting can be understood. It is also a great example of why we need data visualization as part of our analytical and risk toolbox.
With more data we can explore and better understand the relationships across many complex variables and understand and develop risk models more precisely or even improve them in certain cases. The need is to deploy big data analytics to leverage large scale and multi-variable data sets to update our existing maps and models, and thus better cope with the continuing challenges that will occur as a result of natural hazards.